
Explore Tennessee by market
Tennessee is one of the strongest U.S. cash-flow states in 2026. It pairs below-average home prices with a low property tax and no state income tax — three structural advantages that raise an investor’s net yield before a single tenant moves in. Growth is spread across the state rather than concentrated in one metro, which is what lets IPS run different strategies in different Tennessee markets.
Key Takeaways
- Carrying cost: 0.52% effective property tax, roughly half the ~0.9% U.S. average, and no state income tax (Tax Foundation).
- Entry price: $311,678 typical home value (Zillow); $383,637 median sale price, May 2026 (Redfin).
- Broad-based growth: 63,785 new residents in 2025 across 81 of 95 counties — not a single-metro story (Tennessee State Data Center).
- Two IPS markets: Greater Nashville and Chattanooga, which price very differently.
Want this market read against your numbers?
Send your budget, target cash flow and financing and we'll tell you whether Tennessee actually fits — and which of our markets fits better if it doesn't. You'll get the analysis, not a pitch.
Tennessee Market Analysis
Everything behind the score — drivers, cost structure, rental demand, and the criteria we underwrite against.
Three key market drivers
1. Population Growth Across the State
Tennessee added 63,785 residents in 2025, following a record 98,262-person gain in 2024, and 81 of its 95 counties grew (Tennessee State Data Center). Migration from other states is the primary driver, not natural increase — which matters for rental demand, because people relocating into a state typically rent before they buy.
Growth is genuinely distributed, though not evenly. Nashville is the largest engine and still the fastest of the majors — Davidson County grew 1.3% in 2025 against Knox County’s 0.8% (Tennessee State Data Center) — while the Knoxville metro (about 957,000) and the Chattanooga and Clarksville regions all continue to expand. That spread is what lets IPS pursue different strategies in different Tennessee markets rather than betting on one city.
2. Job Growth & Economic Stability
Employment drives household formation, and Tennessee’s economy is diversified across healthcare, logistics and distribution, manufacturing, automotive, tourism, education and professional services — rather than resting on one sector.
The picture in 2026 is positive but moderating. The UT Boyd Center projects continued state growth through 2026, while noting that the labor market has cooled from its post-pandemic pace and downside risks are elevated. Statewide, education and health employment growth flattened to 0.2% over the past year against 3.3% in 2024, while professional and business services and leisure and hospitality added jobs.
For investors, that argues for underwriting rents conservatively and choosing submarkets whose demand doesn’t depend on a single employer — a point that matters concretely in Greater Nashville, where automotive employment is currently contracting.
3. Cost Structure: Prices, Taxes & Affordability
For a buy-and-hold investor, carrying costs matter as much as purchase price — and Tennessee wins on both.
| Factor | Tennessee |
|---|---|
| Effective property tax | 0.52% — roughly half the U.S. average |
| State income tax | None |
| Typical home value | $311,678 |
| State sales tax | 7.00% |
Tax data: Tax Foundation; home value: Zillow. A lower basis plus a 0.52% tax rate is what lets new-construction townhomes in the high-$200Ks to mid-$300Ks pencil to positive monthly cash flow — math that’s hard to replicate in Utah, Arizona, or coastal markets.
Cost structure, rental demand and submarkets
Housing Shortage & Rental Demand
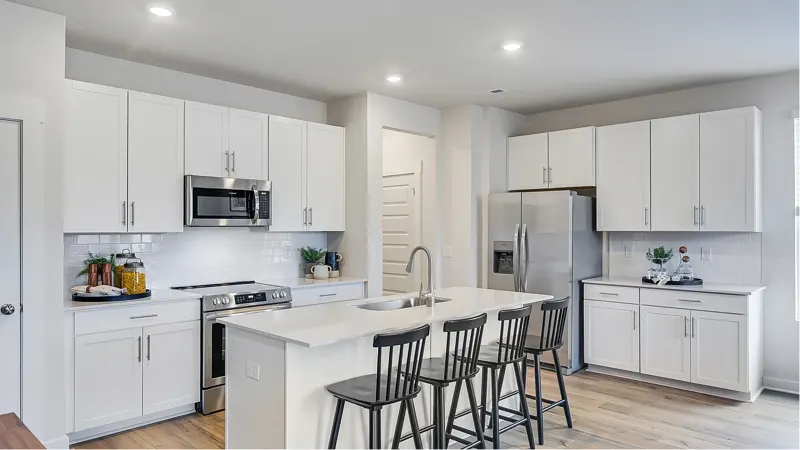
Rapid in-migration has kept Tennessee housing demand ahead of new supply, supporting rents in submarkets where quality rental product is scarce. Renters in these markets typically want newer 3-bedroom homes or townhomes with garages, reasonable commutes, and lower-maintenance living — exactly the new-construction product IPS sources.
What we look for, and how we underwrite it
What We Look For
IPS evaluates each Tennessee opportunity through a disciplined investor lens.
We look for:
- Strong rent-to-price ratio
- Realistic rent comps
- Positive monthly cash flow
- Reasonable HOA and operating expenses
- Quality builder execution
- Functional floor plans
- Strong lease-up potential
- Market demand beyond just appreciation
Typical targets we are seeing in select Tennessee opportunities:
- Purchase prices: approximately $250K–$375K per unit
- Rents: approximately $1,900–$2,500/month
- Expense ratios: approximately 25%–30%
- Cap rates: approximately 6%+
- Cash flow: approximately $200–$400/month per unit, depending on financing and final terms
Why IPS for Tennessee real estate
Disciplined Deal Selection
We do not recommend every project we review. IPS focuses on opportunities where the numbers make sense and the market fundamentals support long-term rental demand.
Builder Relationships
IPS works to identify builders that can deliver quality product, reasonable timelines, and investor-friendly opportunities. This includes both national and regional builders depending on the market.
Investor-Focused Underwriting
We evaluate deals using conservative assumptions, including realistic rents, taxes, insurance, HOA costs, property management, vacancy, and maintenance.
Market Diversification
Tennessee gives investors exposure to a high-demand Southeast market without relying only on expensive Western markets. For investors looking to diversify beyond Utah, Arizona, and Idaho, Tennessee can be a strong fit.
Tennessee Submarkets
Greater Nashville
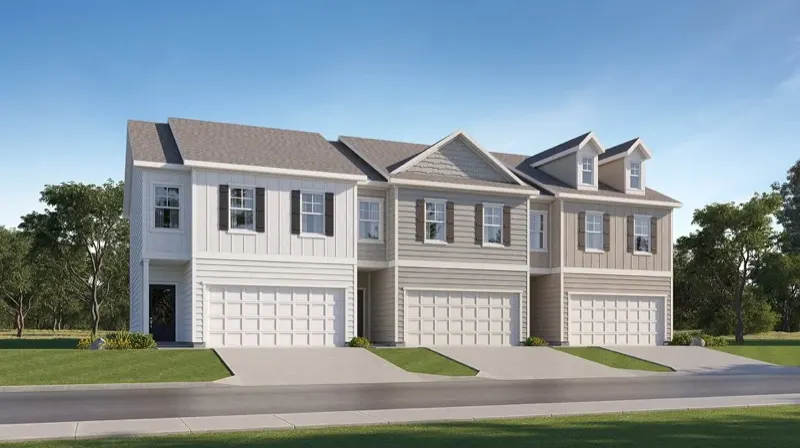
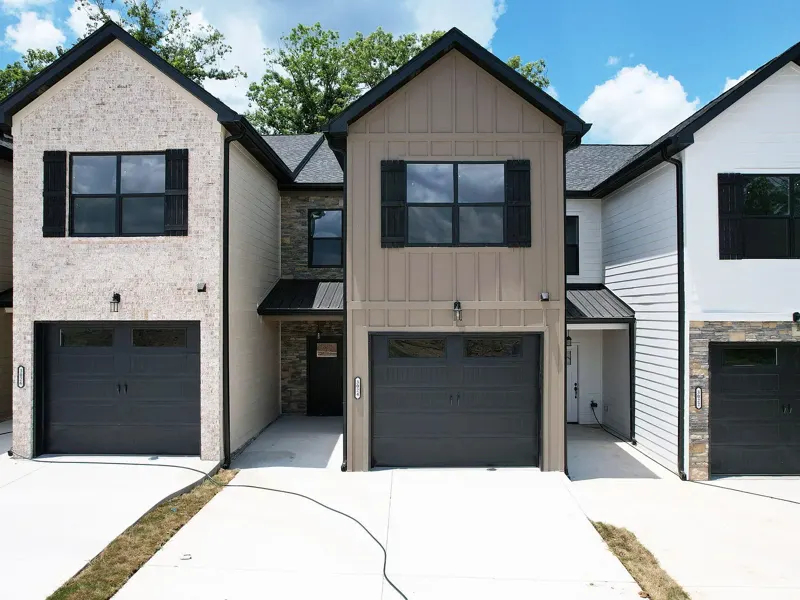
The state’s largest metro and its fastest-growing region. With a metro median around $495,000, IPS buys in the commuter ring — Smyrna, Murfreesboro, Lebanon, Gallatin and Columbia — where new-construction townhomes at $325,000–$332,000 still produce positive cash flow. This is where our current Tennessee inventory sits.
Chattanooga
A lower-basis alternative to Nashville with an accelerating job market, a strong outdoor-lifestyle draw, and entry pricing roughly $100,000 below the Nashville metro median. IPS also sources in the surrounding Hixson and Cleveland submarkets.
Knoxville
A lower-basis East Tennessee market where single-family product still underwrites, anchored by the University of Tennessee and the Oak Ridge research corridor. We are actively sourcing here and publish our criteria openly, though no Knoxville deal has cleared underwriting yet.
Clarksville
Continues to grow and stays on our watch list, but we have not yet found new-construction inventory there that clears our underwriting. We’d rather cover a market well than cover it superficially.
Investment Projects in Tennessee
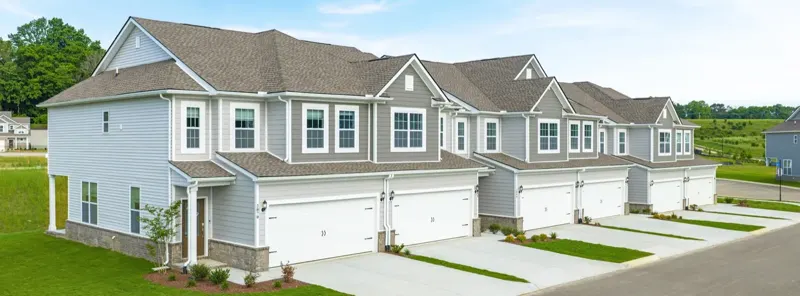 6.4% cap
 Pemberton
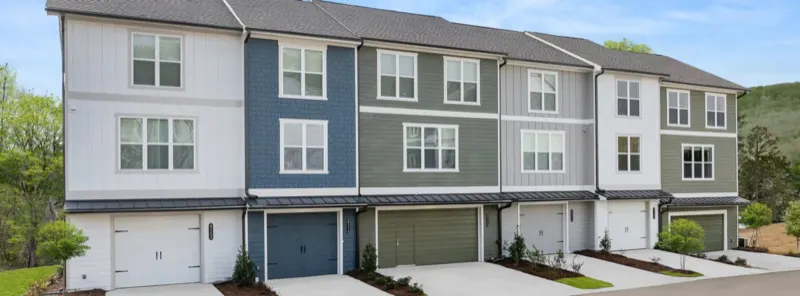 6.1%–6.7% cap
 Asbury Oak
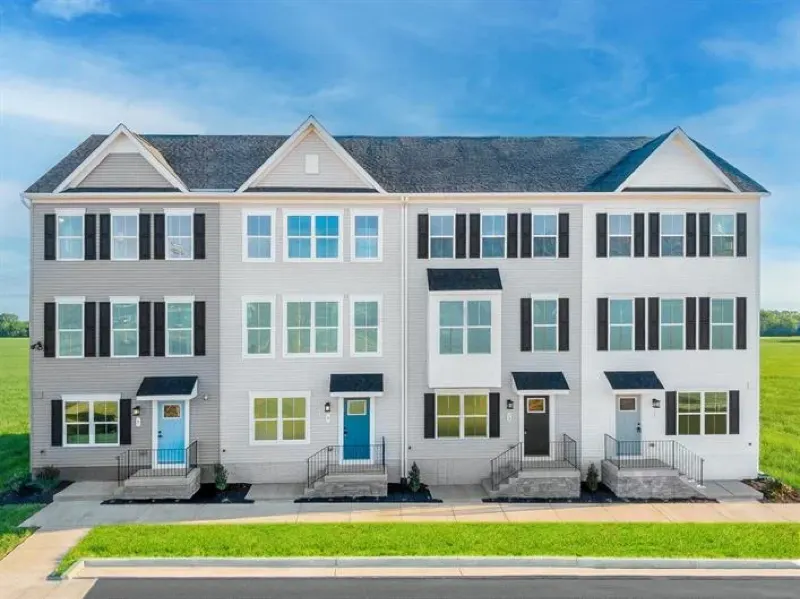 6.6% cap
 Spring Branch Townhomes
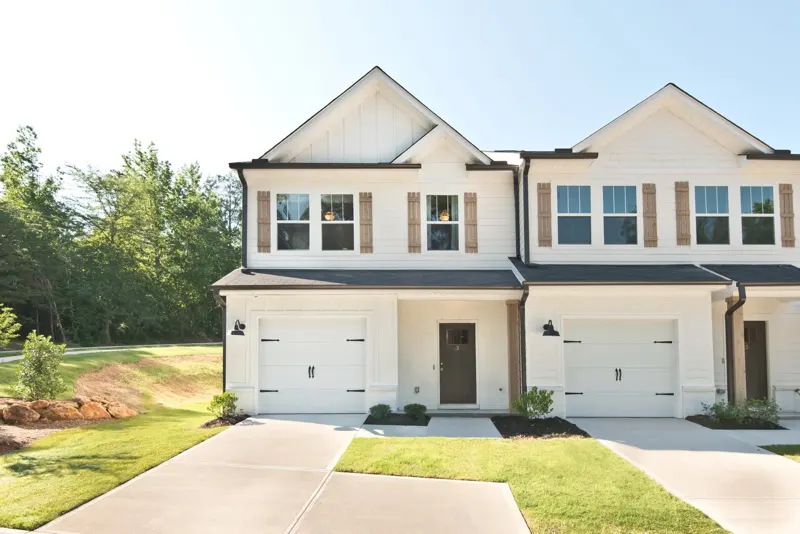 6.2%–6.6% cap
 Coffey Tree
 6.6% cap
 Summit View
 6.6% cap
 Three Creeks Townhomes
 6.0%–6.1% cap
 Cedar Grove Village
Final IPS Take
Tennessee is not about chasing hype. It is about finding the right market, the right builder, and the right cost basis — and those three things look different in Nashville than they do in Chattanooga.
Statewide, the fundamentals hold: distributed population growth, a diversified employment base, relative affordability, and a tax structure that quietly improves every investor’s net yield. What the state can’t do is pick the submarket for you. That part takes disciplined underwriting, deal by deal.
If we wouldn’t buy it, we won’t recommend it.
Frequently Asked Questions
Is Tennessee a good state for cash-flow real estate investing?
Yes — its 0.52% effective property tax rate, absence of a state income tax, and below-average home prices (about $311,678 typical value) combine to raise net rental yield, while statewide in-migration of 63,785 residents in 2025 sustains tenant demand.
Does Tennessee have a state income tax on rental income?
No. Tennessee levies no individual income tax, so rental income is not taxed at the state level (Tax Foundation, 2026).
Which Tennessee market should I invest in?
It depends on your entry budget. Greater Nashville offers the strongest population growth but requires buying the commuter ring at $325,000–$332,000 to cash-flow. Chattanooga offers a lower basis, roughly $100,000 below the Nashville metro median, with accelerating job growth. IPS currently sources in both.
Is Tennessee growth limited to Nashville?
No. Tennessee added 63,785 residents in 2025 with 81 of its 95 counties gaining population. Nashville is the largest metro at about 1.35 million and its core county grew fastest among the majors in 2025 (Davidson 1.3% versus Knox 0.8%), while the Knoxville metro of roughly 957,000 and the Chattanooga and Clarksville regions all continued to expand.