
Indiana is one of the most affordable cash-flow markets in the country. Entry prices are among the lowest of any growth state, and Indianapolis is adding residents at roughly twice the national rate — affordability with demand behind it, rather than affordability because nobody wants to live there.
Key Takeaways
- Entry price: ~$235,000 typical home value (Zillow); $280,055 median sale price, May 2026 (Redfin).
- Property tax: 0.76% statewide, below the national average — but Marion County runs nearer 0.93%, so underwrite the parcel, not the state (Tax Foundation; propertytaxrates.org).
- Income tax: flat 2.95% for 2026, scheduled to fall to 2.90% in 2027 (Tax Foundation).
- Demand: Indianapolis metro reached 2,205,695, adding 22,000+ residents in 2025 (U.S. Census via Indiana Capital Chronicle).
Want this market read against your numbers?
Send your budget, target cash flow and financing and we'll tell you whether Indiana actually fits — and which of our markets fits better if it doesn't. You'll get the analysis, not a pitch.
Indiana Market Analysis
Everything behind the score — drivers, cost structure, rental demand, and the criteria we underwrite against.
Three key market drivers
1. Population Growth
Indianapolis anchors Indiana’s growth. The metro reached 2,205,695 residents, adding more than 22,000 people from 2024 to 2025 — over 1%, roughly double the national average (U.S. Census via Indiana Capital Chronicle; Axios Indianapolis). Marion County and its five largest neighbors have grown by about 104,000 since 2020 — roughly 57% of the entire state’s population gain. New households moving into these corridors typically rent before buying, supporting demand for quality rental product.
2. Job Growth & Economic Stability
Indiana’s economy is supported by a diverse mix of industries, including logistics, manufacturing, healthcare, education, insurance, distribution, and professional services.
The Indianapolis metro remains the state’s largest employment hub. STATS Indiana reported a 2024 resident labor force of more than 1.12M in the Indianapolis region, with a February 2026 unemployment rate of 3.5%, slightly below the statewide rate of 3.8%.
For real estate investors, employment stability matters because jobs drive renter demand, tenant quality, and long-term occupancy.
Indiana’s location also gives it a logistical advantage. Indianapolis is often considered a major Midwest transportation hub, and Fort Wayne/New Haven benefits from affordability and regional job access.
3. Cost Structure: Home Prices, Taxes & Affordability
Indiana’s defining advantage is cost — it offers some of the strongest rent-to-price math of any growth market.
| Factor | Indiana |
|---|---|
| Typical home value | ~$235,000 |
| Median sale price (May 2026) | $280,055 |
| Effective property tax (state) | 0.76% — below national average |
| Indianapolis / Marion County tax | ~0.93% |
| State income tax | 2.95% flat (2026) |
Sources: home values Zillow / Redfin; taxes Tax Foundation and propertytaxrates.org. A low basis plus modest carrying costs is what lets Indiana deals pencil to positive monthly cash flow at entry prices well under most Sun Belt and Western markets.
Cost structure, rental demand and submarkets
Housing Demand & Rental Strength
Indiana’s low basis plus steady Indianapolis-metro growth keeps rental demand firm in submarkets where new, well-located product is limited. Renters here favor newer 3-bedroom homes and townhomes with garages and easy commute access — the new-construction product IPS sources.
What we look for, and how we underwrite it
What We Look For
IPS evaluates each Indiana opportunity through a disciplined investor lens.
We look for:
- Strong rent-to-price ratio
- Realistic rent comps
- Positive monthly cash flow
- Reasonable property taxes and insurance
- Manageable HOA costs
- Quality builder execution
- Functional floor plans
- Strong lease-up potential
- Demand that is not based on appreciation alone
Typical targets we look for in select Indiana opportunities:
- Purchase prices: approximately $225K–$350K per unit
- Rents: approximately $1,700–$2,400/month
- Expense ratios: approximately 25%–30%
- Cap rates: approximately 6%+
- Cash flow: approximately $200–$400/month per unit, depending on financing and final terms
Why IPS for Indiana real estate
Disciplined Deal Selection
We do not recommend every project we review. IPS focuses on opportunities where the numbers make sense and the market fundamentals support long-term rental demand.
Builder Relationships
IPS works to identify builders that can deliver quality product, reasonable timelines, and investor-friendly opportunities.
Investor-Focused Underwriting
We evaluate deals using conservative assumptions, including realistic rents, property taxes, insurance, HOA costs, property management, vacancy, and maintenance.
Market Diversification
Indiana gives investors exposure to a lower-cost Midwest market that may provide stronger cash flow than many higher-priced markets. For investors looking to diversify beyond Utah, Arizona, Idaho, and the Southeast, Indiana can be a strong fit.
Indiana Submarkets
Indianapolis Metro
Large employment base, strong renter pool, and broad resale liquidity.
Fort Wayne / New Haven
Lower entry points, solid rental demand, and potentially stronger cash flow metrics.
Suburban Growth Corridors
Markets with access to jobs, schools, shopping, and transportation corridors can be attractive when pricing remains disciplined.
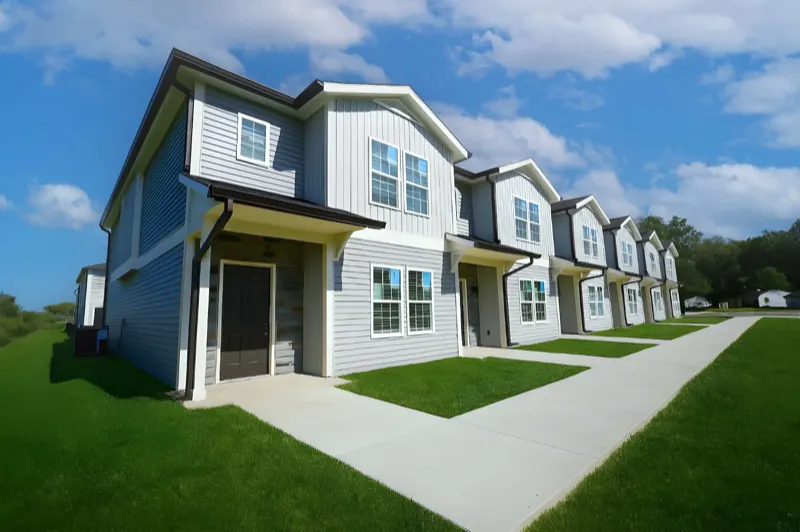
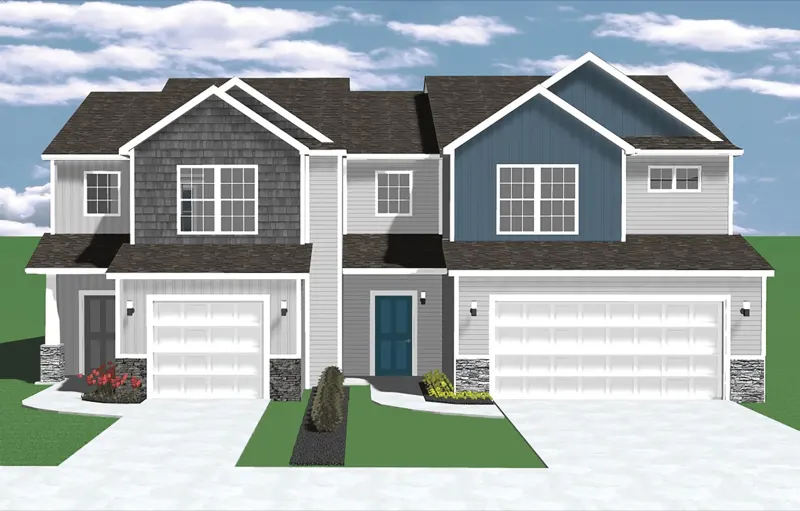
Investment Projects in Indiana
Final IPS Take
Indiana is not about chasing the hottest market. It is about finding practical, affordable, income-producing real estate in markets with stable demand.
With lower entry prices, job stability, population growth in key metros, and continued housing supply constraints, Indiana can offer investors a compelling opportunity for cash flow, diversification, and long-term stability.
If we wouldn’t buy it, we won’t recommend it.
Frequently Asked Questions
Is Indiana a good state for cash-flow real estate investing?
Yes — Indiana has among the lowest entry prices of any growth state (about $235,000 typical home value), a 0.76% effective property tax rate, and a low flat 2.95% state income tax, while the Indianapolis metro grows at roughly twice the national rate. That combination supports strong rent-to-price ratios.
What is Indiana's property tax rate for investors?
Indiana's statewide effective property tax rate is about 0.76% (Tax Foundation, 2026), below the national average; Indianapolis/Marion County runs higher at about 0.93%.
Does Indiana have a state income tax?
Yes, but it is low: a flat 2.95% individual income tax rate in 2026, scheduled to decline to 2.90% in 2027 (Tax Foundation), plus local county income taxes.