
Arizona pairs some of the lowest taxes in the country with metro-Phoenix scale. The tax structure does real work on net yield here. The trade-off is that this is a large, competitive metro rather than a low-basis Midwest market, so entry price has to be underwritten against rent rather than assumed.
Key Takeaways
- Property tax: 0.48% effective rate, among the five lowest nationally (Tax Foundation).
- Income tax: 2.50% flat — the lowest in the nation (Tax Foundation).
- Demand: Maricopa County holds roughly 4.65 million residents and remains one of the fastest-growing large counties (World Population Review).
- Entry price: $438,553 median sale price, April 2026 (Redfin).
Want this market read against your numbers?
Send your budget, target cash flow and financing and we'll tell you whether Arizona actually fits — and which of our markets fits better if it doesn't. You'll get the analysis, not a pitch.
Arizona Market Analysis
Everything behind the score — drivers, cost structure, rental demand, and the criteria we underwrite against.
Three key market drivers
1. Population Growth
Metro Phoenix anchors Arizona’s demand. Maricopa County is home to roughly 4.65 million residents and continues to rank among the fastest-growing large counties in the country, with statewide growth around 1.2–1.3% in 2025 (U.S. Census via worldpopulationreview). Job and household formation across the Valley supports steady rental demand.
2. Job Growth & Economic Expansion
Arizona’s job market has cooled from its strongest growth years, but forecasts call for a modest rebound in 2026 and 2027, with improving job and income growth.
The Phoenix metro continues to benefit from major employment drivers, including:
- Semiconductor manufacturing
- Data centers
- Healthcare
- Logistics and distribution
- Construction
- Aerospace and defense
- Financial services
- Tourism and hospitality
Large employers and infrastructure growth continue to support housing demand across the Phoenix metro and surrounding suburbs. Job access is especially important when underwriting rental demand, which is why IPS looks closely at commute patterns, freeway access, and nearby employment centers.
3. Cost Structure: Prices, Taxes & Affordability
Arizona’s low-tax profile is a structural advantage for investors.
| Factor | Value |
|---|---|
| Effective property tax | 0.48% — among the 5 lowest in the U.S. |
| State income tax | 2.50% flat — lowest flat rate in U.S. |
| Median sale price (Apr 2026) | $438,553 |
Tax data: Tax Foundation; price: Redfin.
Cost structure, rental demand and submarkets
Housing Shortage & Rental Demand
Arizona continues to face a meaningful housing shortage. Common Sense Institute Arizona estimated the state’s cumulative housing deficit at more than 121,000 units as of 2024.
Housing leaders have also pointed to a severe shortage in Arizona, with estimates that the state has been short roughly 50,000 homes per year since 2021 and needs significant new rental supply to keep up with demand.
This supply gap matters for investors because many households remain renters longer when affordability is stretched.
In many Arizona submarkets, renters are looking for:
- Newer single-family homes
- 3–4 bedroom layouts
- Garages
- Low-maintenance yards
- Energy-efficient homes
- Access to employment corridors
- Professional property management
- Reasonable commute times
That is why IPS often focuses on new construction single-family rentals and townhomes in growing suburbs rather than older, higher-maintenance properties.
IPS Arizona Focus
IPS is focused on Arizona opportunities that offer a practical balance of rentability, cost basis, and long-term demand.
Product Types We Like
- New construction single-family homes
- New construction townhomes
- Build-to-rent style communities
- Near-completion inventory
- Projects with builder incentives
- Communities with strong rental demand and manageable HOA costs
Why New Construction?
New construction can be especially attractive in Arizona because it may offer:
- Lower near-term maintenance
- Builder warranties
- Modern floor plans
- Energy efficiency
- Better leasing appeal
- Cleaner resale potential
- More predictable ownership experience
Arizona’s climate also makes newer systems, roofing, HVAC, windows, insulation, and energy efficiency important. Older properties can work, but maintenance and capital expenditures need to be underwritten carefully.
IPS prefers opportunities where investors can close near completion or after construction is complete. This reduces timeline risk and allows us to underwrite closer to actual rent, taxes, insurance, HOA, and lease-up expectations.
What we look for, and how we underwrite it
What We Look For
IPS evaluates each Arizona opportunity through a disciplined investor lens.
We look for:
- Strong rent-to-price ratio
- Realistic rent comps
- Positive or near-positive monthly cash flow
- Reasonable property taxes
- Verified insurance estimates
- Manageable HOA costs
- Quality builder execution
- Functional floor plans
- Strong lease-up potential
- Market demand beyond appreciation alone
Typical ranges we look for in select Arizona opportunities:
- Purchase prices: approximately $300K–$500K+ per unit
- Rents: approximately $2,000–$3,000/month
- Expense ratios: approximately 25%–30%
- Cap rates: often around 5.5%–6.5%, depending on pricing and incentives
- Cash flow: generally tighter than Midwest/Southeast markets, but can improve with builder incentives, pricing reductions, or better financing terms
Why IPS for Arizona real estate
Disciplined Deal Selection
We do not recommend every project we review. IPS focuses on opportunities where the numbers make sense and the market fundamentals support long-term rental demand.
Builder Relationships
IPS works with national and regional builders to identify opportunities that offer better pricing, incentives, timelines, and product quality.
Investor-Focused Underwriting
We evaluate deals using conservative assumptions, including realistic rents, taxes, insurance, HOA costs, property management, vacancy, and maintenance.
Market Experience
Arizona is one of IPS’s core markets. We understand that Arizona can be a strong long-term market, but investors need to be selective and avoid overpaying in areas where rent does not support the purchase price.
Arizona Submarkets
Phoenix Metro
The state’s largest employment hub with strong rental demand, but pricing must be underwritten carefully.
Surprise / Buckeye / Goodyear
West Valley growth corridors with expanding population, newer communities, and more attainable pricing.
Queen Creek / San Tan Valley
Strong long-term growth and tenant demand, though affordability and rent-to-price ratios must be watched closely.
Mesa / Chandler / Gilbert
Established East Valley markets with strong employment access and high tenant appeal, but often tighter cash flow due to higher pricing.
Casa Grande
A more affordable growth corridor between Phoenix and Tucson, with potential upside tied to industrial and logistics expansion.
Tucson
A larger secondary market with university, healthcare, military, and affordability-driven rental demand.
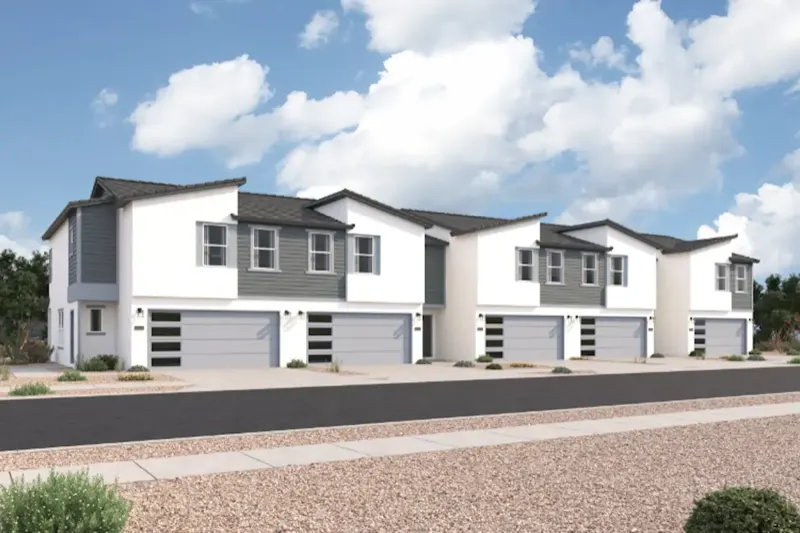
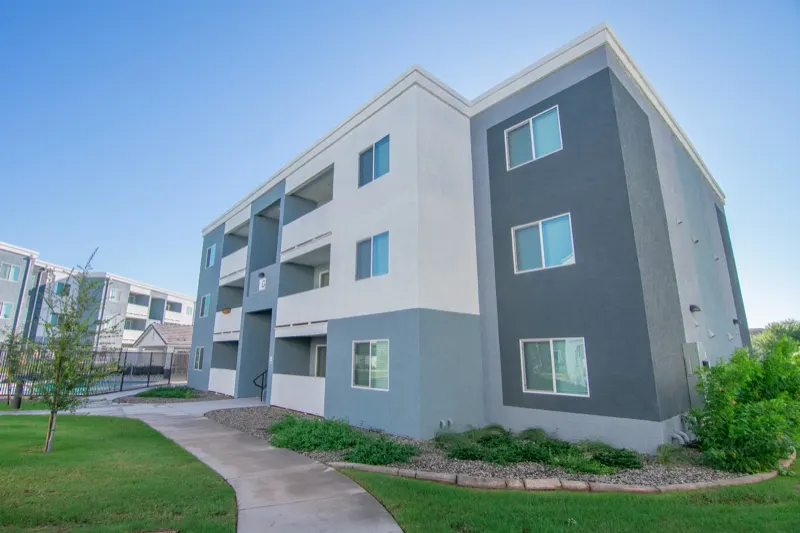
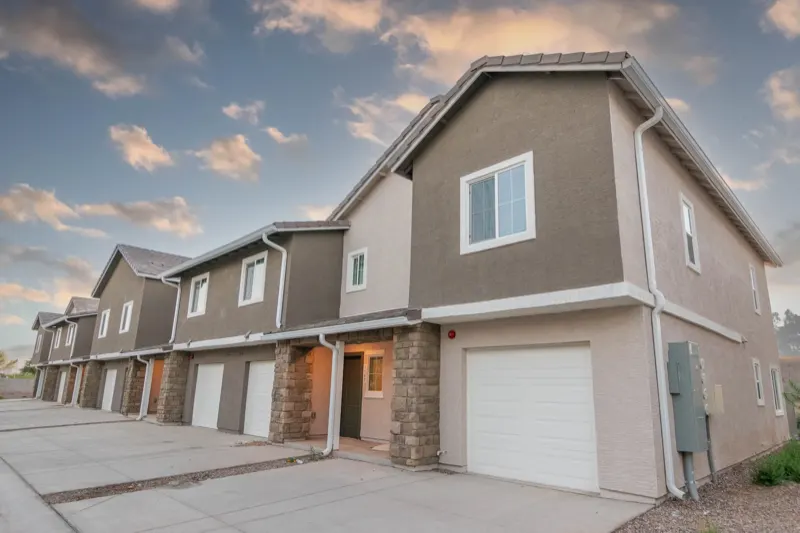
Investment Projects in Arizona
Final IPS Take
Arizona is not just a speculation market. It is a long-term growth market with real demand drivers.
Population growth, job expansion, low property taxes, and a persistent housing shortage continue to support rental demand. That said, pricing has moved up, so investors need discipline. The right Arizona deal must be supported by real rents, verified expenses, and a clear long-term strategy.
If we wouldn’t buy it, we won’t recommend it.
Frequently Asked Questions
Does Arizona have low property taxes for investors?
Yes. Arizona's 0.48% effective property tax rate is among the five lowest in the country, and it has the lowest flat income tax in the nation at 2.50% (Tax Foundation, 2026).
What is the median home price in Arizona?
Arizona's statewide median sale price was $438,553 in April 2026 (Redfin).