
While Nashville’s urban core has experienced significant appreciation, many of the best cash-flow opportunities are now found in the surrounding communities. The metro is still growing quickly, but the growth has moved outward — the commuter-ring counties are expanding faster than Davidson itself. That is where IPS buys, and the gap between core pricing and ring pricing is the whole thesis.
Key Takeaways
- The ring is outgrowing the core: Davidson County grew 1.3% in 2025; Maury 3.2%, Wilson 2.8%, Rutherford and Sumner 1.6% each (Tennessee State Data Center).
- The entry-price gap: ~$495,000 metro median in June 2026, up 3.1% year over year (RE/MAX National Housing Report), against $325,000–$332,000 for IPS townhomes in Smyrna.
- Carrying cost: no state income tax and a 0.52% effective property tax, roughly half the U.S. average (Tax Foundation).
- The risk to underwrite: employment concentration. Nissan is consolidating a Smyrna production line to one shift and Bridgestone announced layoffs — which is why we don’t lean a proforma on any single employer.
Want this market read against your numbers?
Send your budget, target cash flow and financing and we'll tell you whether Nashville actually fits — and which of our markets fits better if it doesn't. You'll get the analysis, not a pitch.
Nashville Market Analysis
Everything behind the score — drivers, cost structure, rental demand, and the criteria we underwrite against.
Three key market drivers
1. Population Growth — and Where It’s Landing
Davidson County remained Tennessee’s fastest-growing county by headcount in 2025, adding 9,281 residents (+1.3%). But the more useful number for an investor is percentage growth in the ring around it (Tennessee State Data Center):
| County | 2025 growth | Rate |
|---|---|---|
| Maury (Columbia, Spring Hill) | +3,675 | 3.2% |
| Wilson (Lebanon, Mt. Juliet) | +4,693 | 2.8% |
| Rutherford (Murfreesboro, Smyrna) | +6,266 | 1.6% |
| Sumner (Gallatin, Hendersonville) | +3,357 | 1.6% |
| Davidson (Nashville) | +9,281 | 1.3% |
| Williamson (Franklin, Brentwood) | +3,575 | 1.3% |
Maury and Wilson counties grew more than twice as fast as Davidson in percentage terms, and Rutherford County added nearly 45,000 residents between 2020 and 2025 — the largest numeric gain in Middle Tennessee. Growth is not concentrating downtown. It is spreading along the interstate corridors, which is precisely where demand for three-bedroom homes with garages comes from.
2. Job Growth — and the Concentration Risk Worth Naming
The Nashville metro supported roughly 1.21 million nonfarm jobs as of December 2025 (U.S. Bureau of Labor Statistics), spread across healthcare, logistics and distribution, manufacturing, finance, education, tourism and professional services. That diversification is the market’s genuine strength.
It is also why we’d rather name the soft spots than list logos. Three things an honest Nashville-metro proforma should account for in 2026:
- Nissan Smyrna employs roughly 5,700 people, but is consolidating one of its two production lines to a single shift and has offered voluntary buyouts.
- Bridgestone Americas announced significant layoffs in 2025.
- Oracle’s $1.35 billion East Bank campus — the project behind the widely-quoted 8,500-job target — has still not broken ground. Oracle currently leases roughly 2,000 office seats across three Nashville locations.
None of that makes Nashville a weak market. Healthcare alone — HCA Healthcare, Vanderbilt University Medical Center, Community Health Systems — anchors a large share of metro employment, and the UT Boyd Center projects continued Tennessee growth through 2026, though slower than recent years with a cooler labor market. What it does mean is that a Smyrna proforma shouldn’t rest on one employer, and we underwrite rents accordingly.
3. Cost Structure: What You Actually Pay
For a buy-and-hold investor, carrying cost decides the return as much as purchase price does — and this is where Middle Tennessee earns its place.
| Factor | Greater Nashville |
|---|---|
| State income tax | None |
| Effective property tax | 0.52% — roughly half the U.S. average |
| Metro median sale price | $495,000 (June 2026, record high) |
| Typical IPS entry price | $325,000–$332,000 |
| Typical IPS rent | $2,395–$2,499 / month |
Tax data: Tax Foundation; price: RE/MAX National Housing Report. The spread between the metro median and the IPS entry price is the entire reason we buy outside the core: at $495,000 the rent required to cash-flow simply isn’t there, and at $325,000 in Smyrna it is.
Cost structure, rental demand and submarkets
Rental Demand in the Commuter Ring
Middle Tennessee’s in-migration arrives faster than new housing is delivered, and a large share of new arrivals rent before they buy. With a metro median near $495,000, the gap between what a household can rent and what it can purchase has widened — which sustains demand for quality rental product in the commuter communities.
The renters competing for that product consistently want the same things:
- Three bedrooms and a functional layout
- A private garage rather than shared parking
- Newer finishes and lower maintenance
- A workable commute to Nashville, Murfreesboro or Franklin employment
- Fewer shared walls than an apartment offers
That is the profile IPS sources against — and the reason new-construction townhomes tend to lease above Class A apartments in these submarkets rather than competing beneath them.
Supply: The Number to Watch
Middle Tennessee builders have been active, and apartment deliveries are the single biggest variable in a Nashville-area proforma. Heavy Class A apartment supply landing at once softens rents, and single-family rentals and townhomes sit just above Class A in the rental stack — so they feel it.
Before recommending anything, IPS reviews apartment deliveries scheduled in the submarket, current concessions, Class A rent trends, single-family rental comps and lease-up velocity. Supply varies enormously between Smyrna, Murfreesboro and Gallatin; metro-level vacancy tells you almost nothing about a specific street.
Why New Construction
In this market new construction earns its premium through lower near-term maintenance, builder warranties, better energy efficiency, layouts renters actually want, faster lease-up than dated product, and a cleaner resale story. Wherever possible IPS prefers completed or near-completion inventory — it removes timeline risk and lets us underwrite against real rent, tax, HOA and insurance numbers instead of estimates.
What we look for, and how we underwrite it
IPS Greater Nashville Search Criteria
Location
We prefer submarkets with genuine commute access to more than one employment center, nearby retail and daily conveniences, and rental demand from families and working professionals rather than a single employer’s workforce.
1. Entry Basis Relative to Rent
Nashville has already delivered a decade of appreciation. That rewards existing owners but compresses cash flow for new buyers, so we look for submarkets where pricing is still supported by rents rather than by expectation. If a deal only works on appreciation, it isn’t a deal we bring to investors.
2. Job Quality, Not Just Job Count
Healthcare, logistics, education, finance and professional services support tenant stability better than a market resting on low-wage service work — or on one large plant. Given Nissan’s Smyrna reduction, we specifically test whether a submarket’s rental demand survives the loss of its single largest employer.
3. Income Growth
Rent growth is only sustainable where incomes support it. Where rents have outrun local income growth, lease-up slows and concessions appear — so we underwrite rent assumptions conservatively rather than trending them forward.
4. Schools and Neighborhood Trajectory
School quality and neighborhood reinvestment correlate strongly with tenant quality, tenure length and long-term resale liquidity. We review these together with crime data, property management feedback and planned development — location quality matters as much as the proforma.
5. Supply and Vacancy
Reviewed by submarket and product type, never at metro level: current apartment vacancy, scheduled deliveries, concessions, Class A rent trends, single-family rental comps and lease-up pace.
6. The Numbers
Every opportunity is underwritten on cap rate, monthly cash flow, rent-to-price ratio, expense ratio, HOA, property taxes, insurance, property management, vacancy and maintenance reserves.
What current IPS Nashville-area opportunities actually look like:
- Purchase price: $325,000–$332,000
- Rent: $2,395–$2,499 / month
- Cap rate: 6.0%–6.6%
- Cash flow: $224–$363 / month, depending on financing and final terms
- Expense ratio: approximately 25%–30%
Those are the figures from live inventory, not targets. Greater Nashville is a market where a disciplined 6% is realistic and a promised 8% should make you ask questions.
7. Product Type
New-construction townhomes and single-family rentals, build-to-rent communities, three-bedroom floor plans with two-car garages, near-completion inventory, and projects carrying builder incentives.
Why IPS for Nashville real estate
Disciplined Deal Selection
We don’t recommend every project we review. Greater Nashville has real fundamentals, but at current pricing plenty of deals in this metro simply don’t work — and we say so.
Builder Relationships
IPS works with national and regional builders across Middle Tennessee to secure pricing, incentives and access to inventory before projects reach the wider market.
Conservative Underwriting
Our proformas use verified expenses and realistic rents — taxes, insurance, HOA, management, vacancy and maintenance included. We publish the range live inventory actually produces rather than a best case.
We Name the Risks
Employment concentration in Smyrna, apartment supply in Murfreesboro, commute distance in Columbia. An investor who knows the risk going in makes a better decision than one sold a clean story.
Nashville Submarkets
Smyrna / La Vergne
Where IPS currently holds inventory. Strong rent-to-price ratios, direct I-24 access to both Nashville and Murfreesboro, and townhome product in the $315K–$375K band. The caveat is employment concentration — Nissan’s shift consolidation matters here more than anywhere else in the metro, so we underwrite tenant demand across multiple employers.
Murfreesboro
The largest submarket in Rutherford County, anchored by Middle Tennessee State University and a deep healthcare and logistics base. Population growth is reliable; pricing has moved enough that entry basis needs watching closely.
Lebanon / Mt. Juliet
Wilson County grew 2.8% in 2025 — the second-fastest rate in the metro. Expanding residential development with relative affordability, though Mt. Juliet pricing has tightened faster than Lebanon’s.
Gallatin / Hendersonville
Sumner County offers established suburban demand and good schools north of the city. More appreciation-oriented than pure cash flow; the numbers have to be checked deal by deal.
Spring Hill / Columbia
Maury County was the fastest-growing county in the metro at 3.2%. Genuine upside and lower entry, but it is the furthest commute in the ring, so rent comps and lease-up velocity deserve extra scrutiny.
Antioch
Inside Davidson County with workforce-housing demand and better affordability than the urban core. Submarket selection within Antioch varies block to block more than anywhere else on this list.
Cap Rates in Nashville Right Now
9 projects listed here underwrite to a projected 5.9%–6.5% cap rate at $265,000–$340,000, with projected monthly cash flow of $118–$252.
Both figures come from one shared set of underwriting assumptions applied to every deal on this site — the same expense ratio behind the cap rate, the same loan terms behind the cash flow — so two projects are comparable to each other, and to any other market here.
These are projections on new construction, not closed results, and they move with pricing and rents. If you would rather check them against your own assumptions than take ours, the method is written up in how we analyse a deal — or send us a property, in Nashville or anywhere else, and we will underwrite it with you.
Investment Projects in Nashville
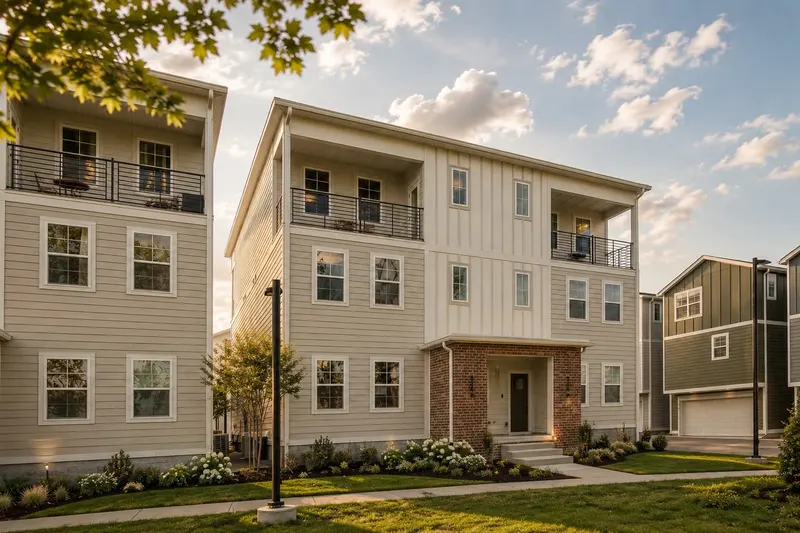 6.5% cap
The Chadwick
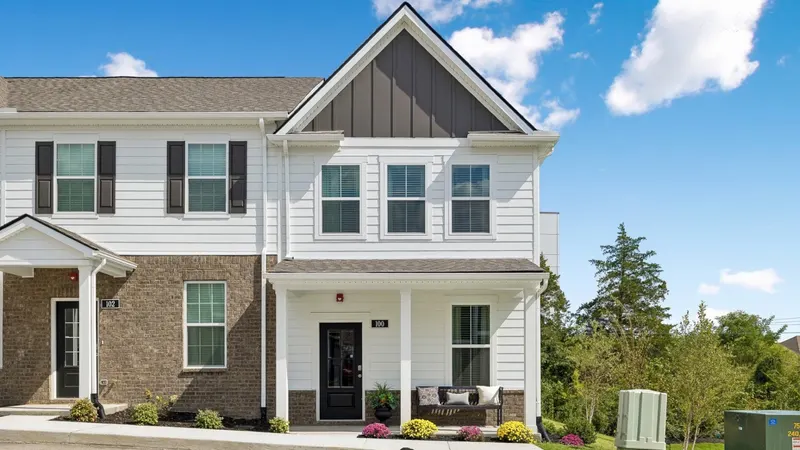 5.9% cap
Blair Ridge
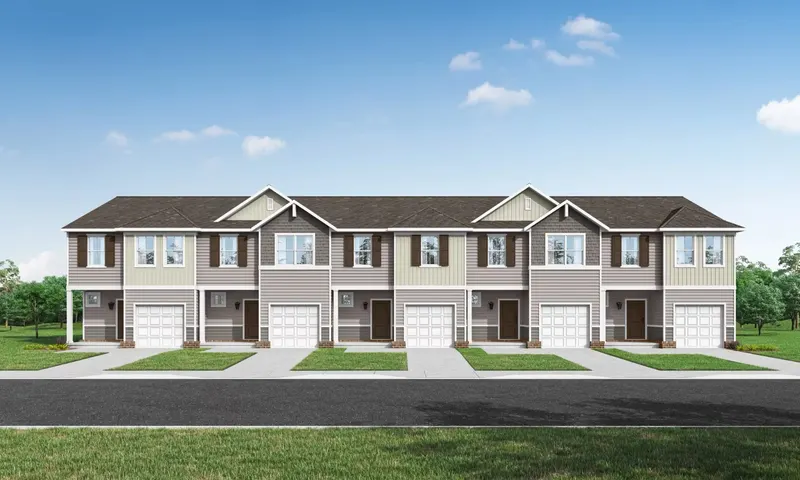 6.1% cap
Gwynn Farms
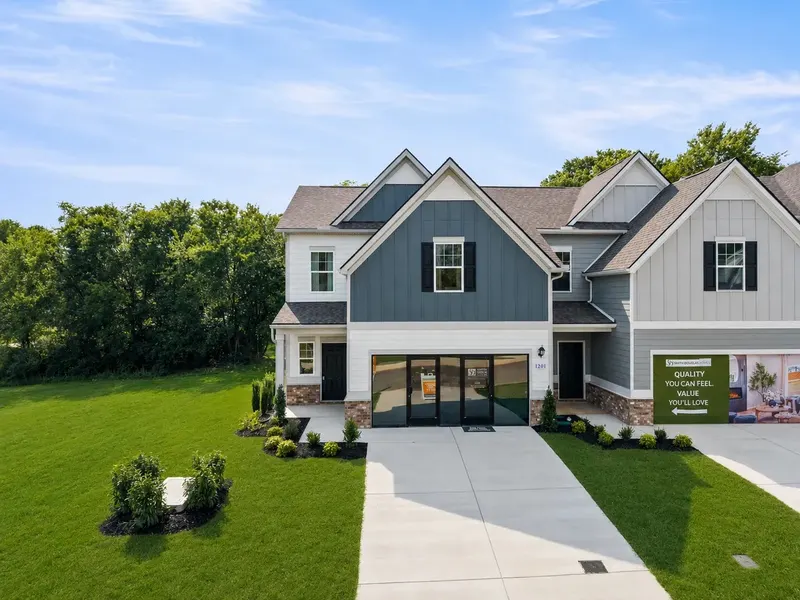 6.2% cap
Spring Branch TH (SDH)
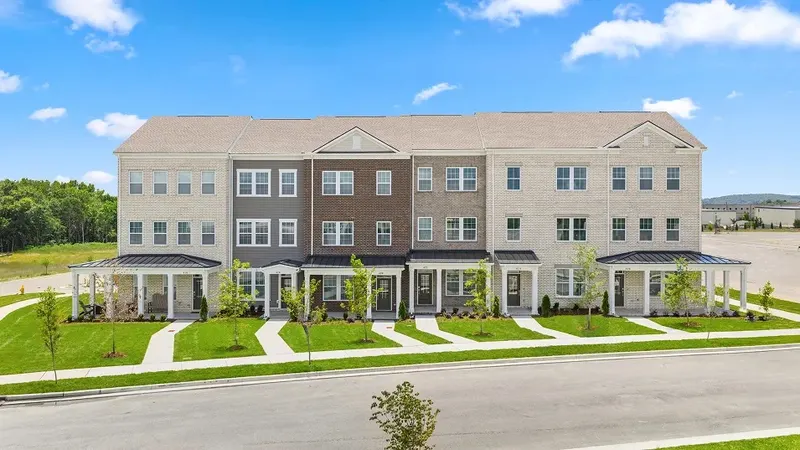 6% cap
One Lebanon Place
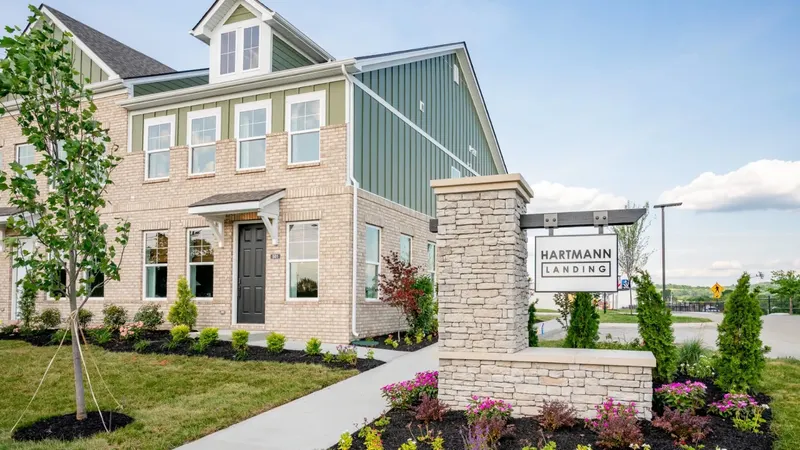 6.4% cap
Hartmann Landing
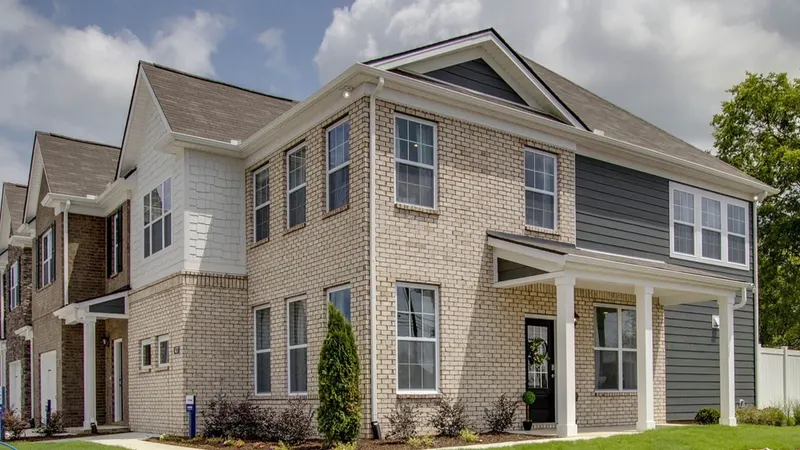 6.1% cap
Campbell Place
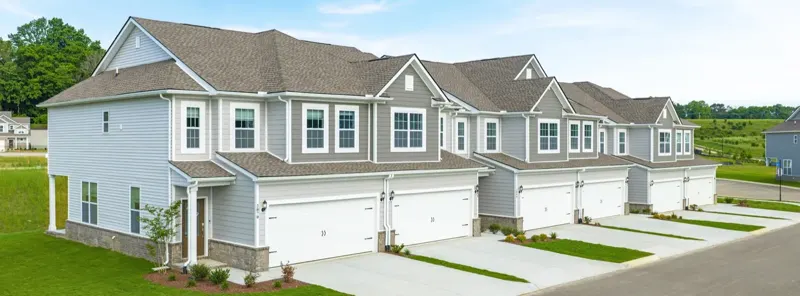 6.2% cap
Pemberton
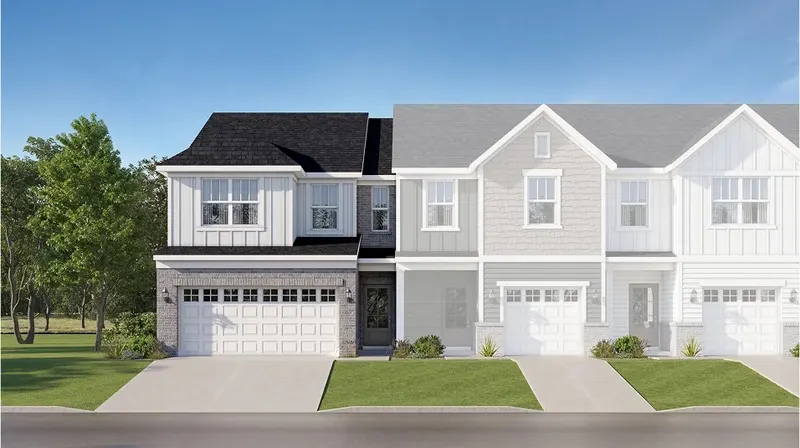 6%–6.1% cap
Cedar Grove Village
 SOLD
SOLDVillage at Spring Creek
SOLDHoney Farms
SOLDMountain View
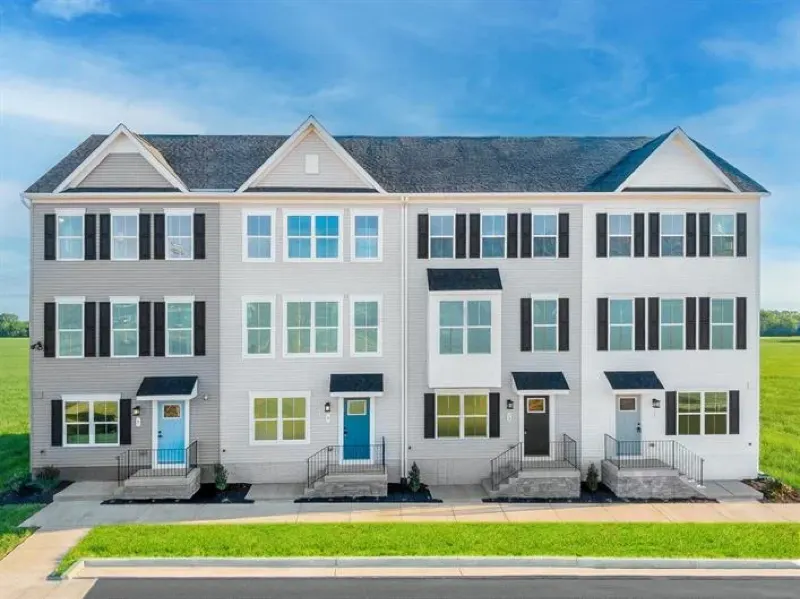 SOLD
SOLDSpring Branch Townhomes (RH)
Final IPS Take
Greater Nashville remains one of the strongest long-term rental markets in the Southeast — but the way to invest in it has changed.
At a $495,000 metro median, buying the core for cash flow no longer works. The opportunity sits in the commuter ring, where the fastest population growth in the metro is actually landing, entry basis is $150,000 lower, and Tennessee’s tax structure does the rest. That thesis depends on choosing the right submarket and underwriting employment honestly — not on the market rising.
If we wouldn’t buy it, we won’t recommend it.
Frequently Asked Questions
Is Nashville a good place to invest in real estate in 2026?
The Nashville metro is strong, but the core has priced past cash flow — the median sale price hit a record $495,000 in June 2026. IPS invests in the surrounding commuter communities such as Smyrna, Murfreesboro and Lebanon, where new-construction townhomes at $325,000–$332,000 still produce 6.0%–6.6% cap rates and positive monthly cash flow.
Which Nashville-area suburbs are growing fastest?
By percentage growth in 2025, Maury County (Columbia, Spring Hill) led at 3.2% and Wilson County (Lebanon, Mt. Juliet) at 2.8% — both more than double Davidson County's 1.3%. Rutherford County added the most residents in Middle Tennessee over 2020–2025, roughly 45,000 (Tennessee State Data Center).
Does Tennessee have a state income tax on rental income?
No. Tennessee levies no individual income tax, so rental income is not taxed at the state level, and the effective property tax rate is about 0.52% — roughly half the U.S. average (Tax Foundation, 2026).
What cap rate should I expect on a Nashville-area rental?
Current IPS Nashville-area inventory underwrites to 6.0%–6.6% cap rates with $224–$363 monthly cash flow on $325,000–$332,000 townhomes. In this metro a disciplined 6% is realistic; advertised returns well above that usually rest on optimistic rent assumptions or understated expenses.